Schlieren Photography: Flow Analysis During TIG Welding
Schlieren photography depicts the local fluctuation of the refractive index of a liquid or gas. Here, the smallest air flows, which are caused by different gas densities and temperatures, can be visualised. With this method, the flow of shielding gas during TIG welding should be quantitatively investigated and optimised for future applications.
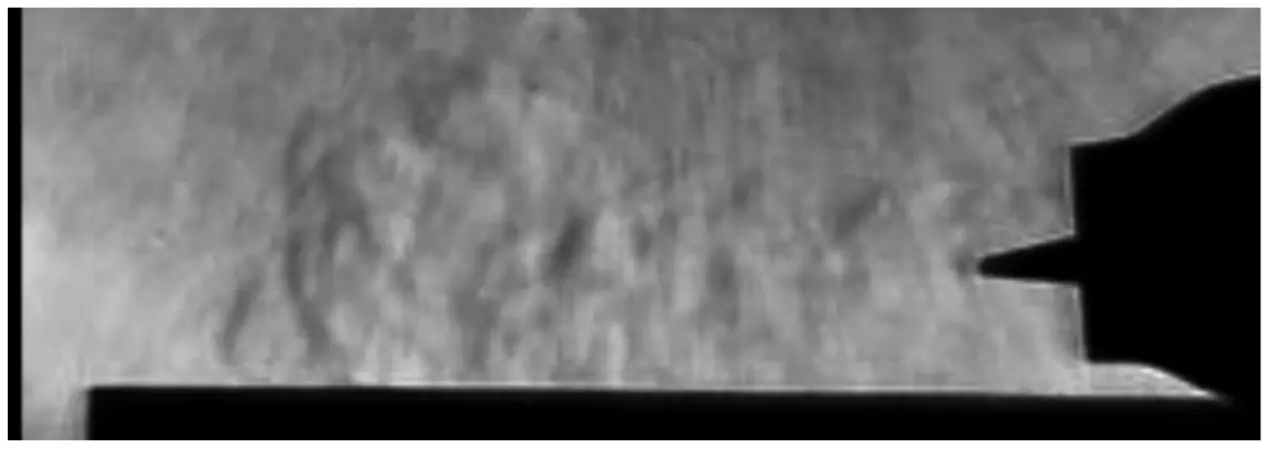
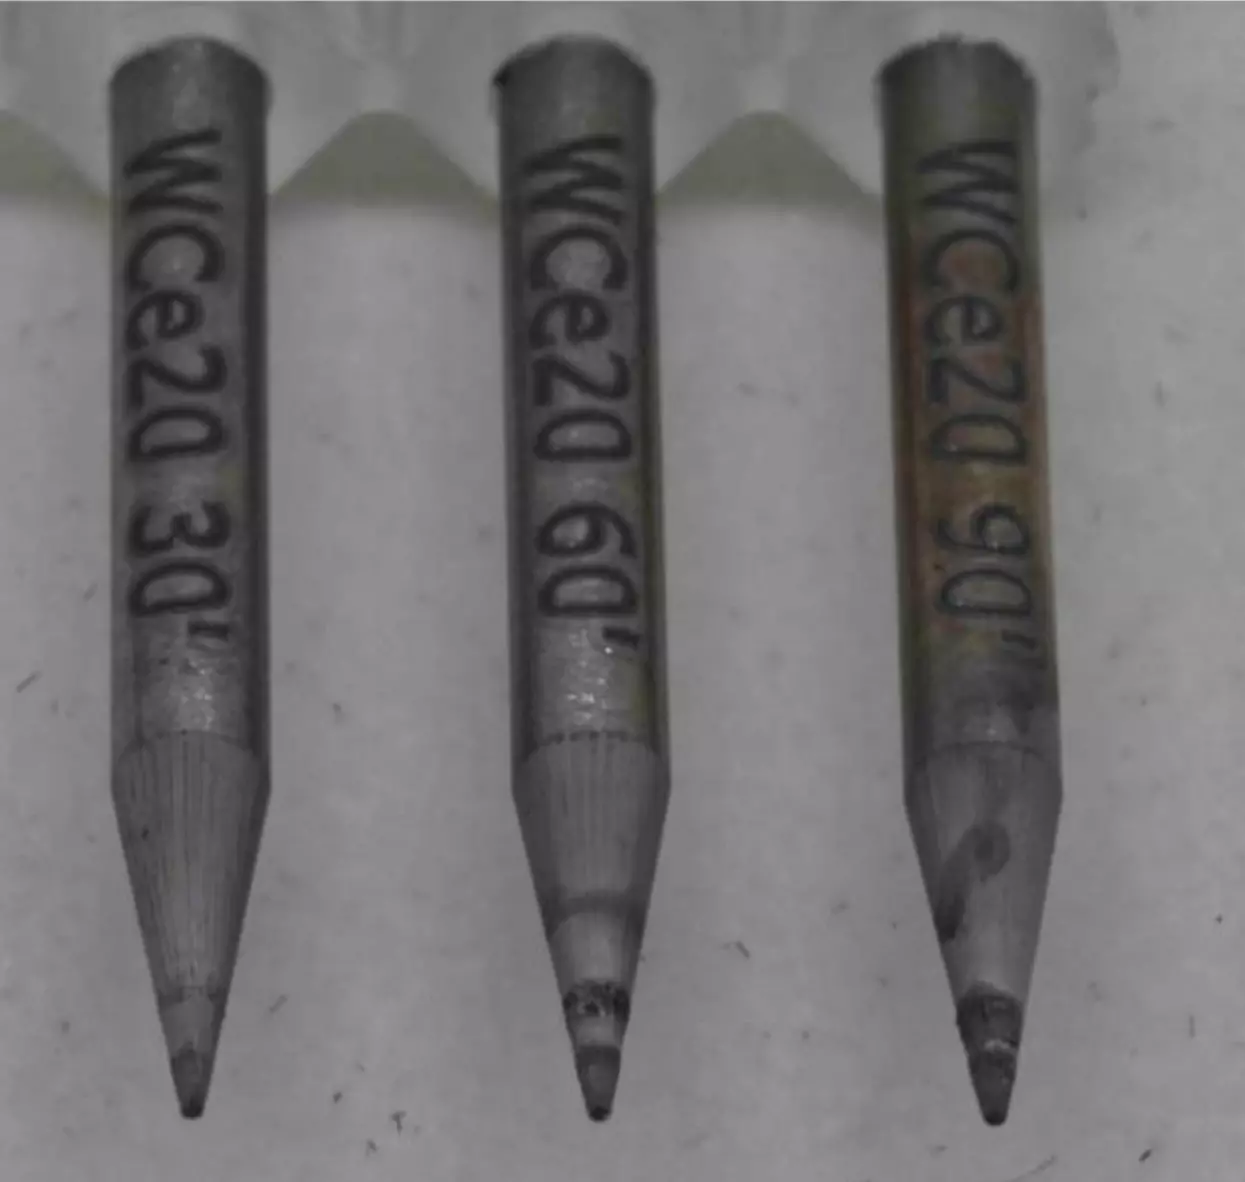
In the tungsten inert gas welding process, TIG for short, an electric arc is created between the tungsten electrode and the component to be welded. During the entire welding process, the tungsten electrode is surrounded by a shielding gas, usually argon, to protect it from oxidation by the oxygen in the air. In theory, the electrode, therefore, remains intact. Nevertheless, a wide variety of influences cause the tungsten electrode to undergo oxidation. Figure 1 shows three welding electrodes that were in use for different periods. It can be seen that the longer the electrode is used, the more marked the oxidation at the tip. Consequently, it can be assumed that the inert gas does not shield the electrode perfectly from the ambient air. Therefore, an attempt will be made to visualise the shielding gas flow during the welding process using schlieren photography. Wolfram Industrie GmbH has set up a test setup for this purpose, with which the first schlieren videos were created (see Figure 2). However, such schlieren videos only provide a qualitative statement about the shielding gas flow. Figure 1: From left to right TIG welding electrodes after 30, 60, and 90 minutes of operating time. The oxidation traces on the electrode tip are visible.
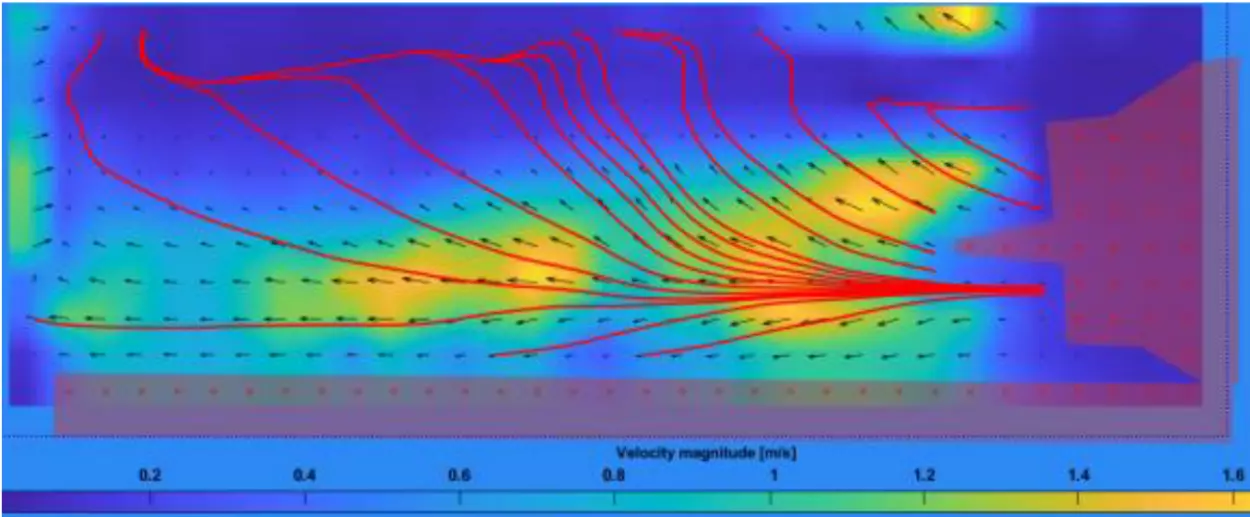
For a few years now, algorithmic analyses of schlieren videos - so-called quantitative schlieren photography - have made it possible to extract local, vectorial flow velocities and local temperatures from schlieren videos. With PIVlab, an open-source Matlab add-on for particle image velocimetry, an attempt will be made in a first step to evaluate these schlieren videos. For this purpose, the schlieren video from Figure 2 was analysed with the help of PIVlab and an average value was calculated over the entire recording time (see Figure 3). This evaluation shows an excellent picture of the average flow velocity and its flow pattern (red streamlines).
Thus, this tool is ideal for evaluating the protective gas flows for a wide variety of environments. In this respect, this method can help in the design of future gas nozzles and their field of application.