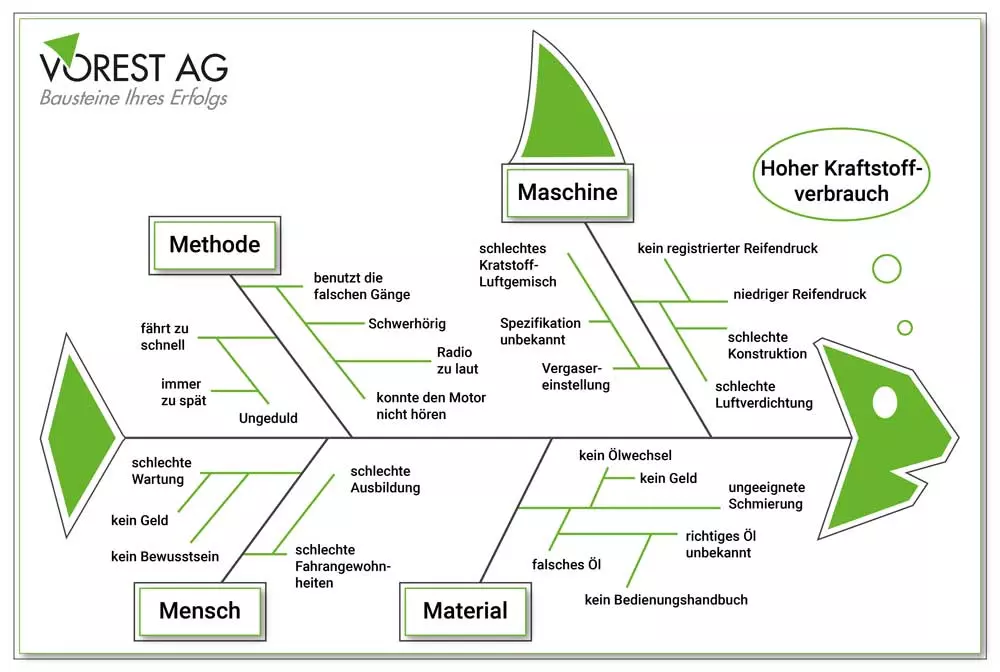
Cause-and-effect diagram
Background: Originally used to identify the causes of quality problems in the production process.
Goal: Method for a complete analysis of a problem and its causes.
Approach: 5 successive steps. 1) Draw a fish bone diagram and enter the most important influencing factors at the end of the bone line (4M: Material, Machine, Method, Man; extended as 8M by: Management, Measurement, Milieu, Money). 2) Determine the main and secondary causes for each of these influencing factors and add them to the "fishbones" of the influencing factors (example: human influencing factor. Secondary factors: education, motivation, fatigue, etc.). 3) Check for completeness (facilitated by visualization). 4) Weight the probabilities with which the influencing factors and the secondary factors influence the problem 5) Based on the expertise of the specialists, the most probable factors are assessed and highlighted with regard to their influence on the problem.
Advantage: good basis for discussion in group work, low effort, easy to learn and apply.
Disadvantage: no networked cause-and-effect analyses, temporal interdependencies cannot be recorded. Offers no support for the creation of new ideas, keywords and unforeseen links: https://www.sixsigmablackbelt.de/ishikawa-diagramm/