Looking on eutrophication processes
This experiment will introduce the pupils to a simple method to determine nitrate levels and link them to the issue of human impact like eutrophication and acidification.
Water pollution is not always visible, and many poisonous substances do neither smell nor taste. We will therefore not be able to determine the water quality with our senses alone. Some hazardous substances like pesticide residues are so difficult to detect, that sometimes even highly sophisticated analytical laboratories are struggling in determining the water quality of a river. Also, new pollutants are discovered as the detection methods are developed.
Learning goals
- Know how to use indicator paper strips to measure nitrate and pH
- Understand the relation between nitrate and water pollution
Background information
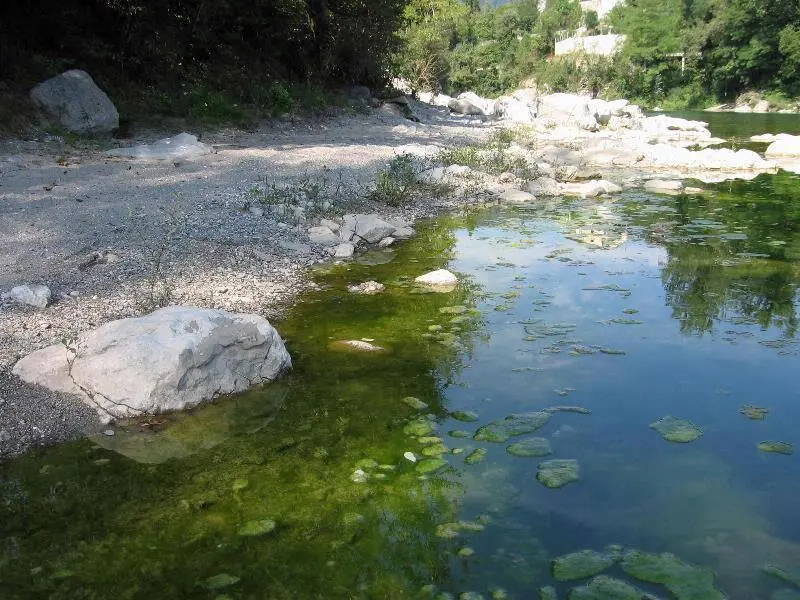
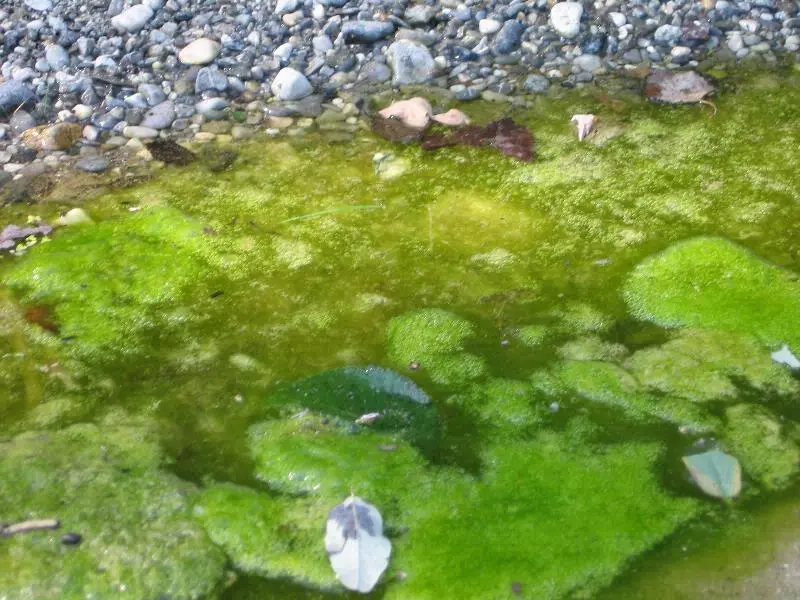
Eutrophication belongs to the main types of water pollution in Western Europe. Eutrophication means an enrichment in the nutrient levels of the watershed which is caused by nutrient discharges from agriculture and sewage effluents. Elevated nutrient levels can trigger serious changes in the colonisation of a river. Nutrient rich water will favour algal growth which in turn leads to a higher turbidity of the water. This results in changed conditions for the fish to find their food. Clear water fish like salmon or trout will disappear in favour of species adapted to turbid conditions like carps (cyprinoids). Vegetation and fauna can therefore be used as bio-indicator for the eutrophication level.
Nitrogen and phosphorous are the main nutrients which are causing eutrophication. Nitrate is, in contrast to phosphate, easy to assess with indicator paper strips. This experiment therefore uses nitrate as chemical indicator for the eutrophication level of a river
Time requirement
The experiment will take 2-4 hours and is recommended to be planned as a half day excursion. The time requirement will also be highly dependent on how far you need to travel to come to a suitable river location.
Material requirement
- 20-30 beakers
- 1 nitrate indicator test
- 2-3 field guides for plants
Let's start
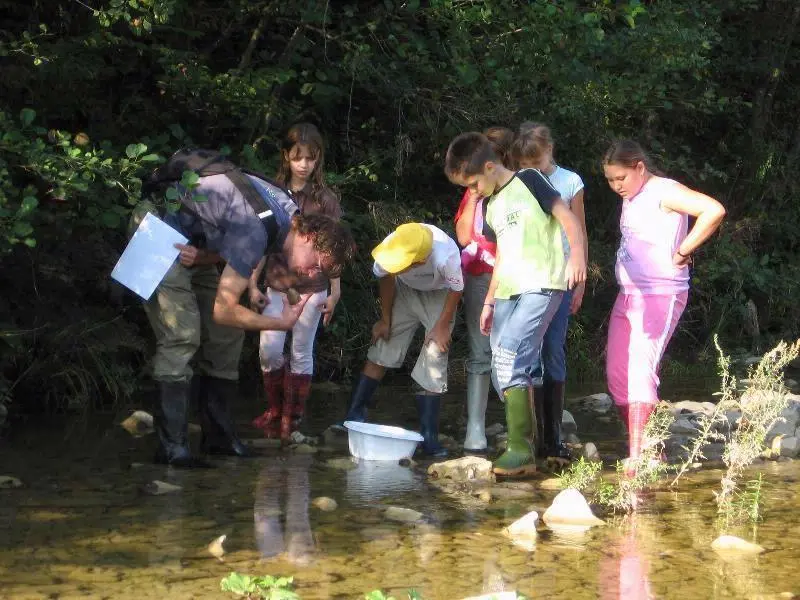
To measure the nitrate take a water sample with the beaker and dip the indicator strip into the water. Compare the colour of the strip with the colour scale on the box.
Take nitrate samples at different locations with different types of vegetation and different colours and turbidity levels. Are there any differences? Determine the key species in the different vegetation types with help of a plant field guide and link them to the nitrate levels you measured at this location. Strive to develop a plant indicator table like the example below.
The colour of the water is measured according to the experiment «Vegetation as a natural water filter».
See and feel
- Nitrate levels
- Turbidity and colour
- Vegetation (what types of species)
Didactical comments
Ask the children to wear rubber boots. Consider the security issues outlined in experiment «Orientation and terrain structures along rivers».