Methodical approach and data collection
The IT Nearshoring Index reflects various dimensions of the decision of Swiss IT service firms to nearshore some of their activities and consists of 5 pillars.
To identify the relative importance of different determinants the Center of European Business at the ZHAW School of Management and Law in cooperation with swissICT (largest association in the Swiss IT industry) and ISSS (Information Security Society Switzerland, leading association in Swiss IT Security industry) conducted a survey among Swiss IT service firms.
We received 56 high quality response. 82% (46 firms) of the responding firms are engaging actively in nearshoring in various destination in Europe. About 41% of all firms have more than 100 employees and a quarter has revenues exceeding USD 50 million. In the questionnaire firms were asked to rate the importance of different factors for their nearshoring decision on a scale of 1 to 7, where 1 being not important at all and 7 very important.
Based on these questions we identified 5 mayor determinants of firms’ nearshoring decisions. We commonly refer to these determinants as pillars of our IT Nearshoring Index.
Construction of the IT Nearshoring Index
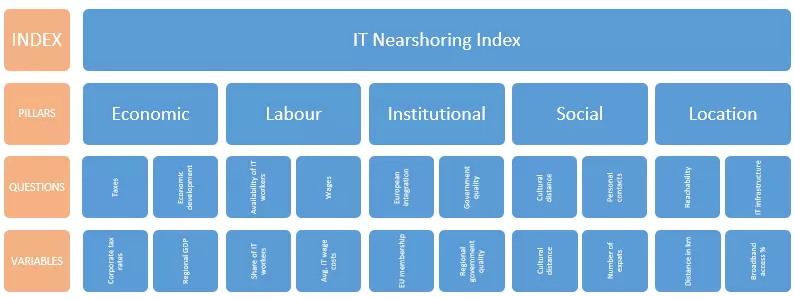
The overall index consists of five pillars: Economic, labour, institutional, social and location pillar. Each pillar is created by weighting several variables that are associated with the respective pillar, i.e., matched by the underlying survey question. The overall IT Nearshoring Index consist of a weighted average of these five pillars. Figure 1 graphically depicts the structure of the IT Nearshoring Index.
We use data from various sources focusing on Eurostat Nomenclature of Territorial Units for Statistics (NUTS) level 1 regions. The variables were chosen to match the underlying questions of the survey. For example, firms were asked how important the market potential of the region is. We proxy the market potential by GDP and GDP per capita growths. Similarly, the reachability of a region was proxied by the distance in kilometer from Berne and the number of airport passengers in the region. For each question we identified a broad set of variables that can be used to describe the attractiveness of a region for IT service firms.
Focusing on Eurostat NUTS 1 regions allows a much finer distinction within countries, as regional variation and difference can be an important factor for firms’ nearshoring decision. If variables are only available at NUTS 2 level, we aggregate them, using population weights where appropriate. If only country level variables are available, we apply them to all NUTS 1 regions within the country. We always consider the last available year in the data, which most of the time is 2017 or 2018. Our main data source is the Eurostat regional database, which gives a broad set of variables at various NUTS levels. We provide an online Appendix with detailed variable description and source information. In our data set some observations are missing for some regions. We use a machine learning approach to impute the missing values. Specifically, we employ multi-equation imputation of missing observations within each pillar using a random forest approach, see Wulff and Ejlskov (2017). In total we have 50 variables assigned to the 5 pillars and we cover 115 NUTS 1 regions in Europe. While the Eurostat regional database is the most comprehensive source for detailed regional statistics, its coverage of countries is far from complete. Some interesting nearshoring destinations like Serbia, Ukraine or Albania are missing due to the lack of reported data to the European Union or difference in the data collection. However, as we will see later on, the main competitive advantages of these regions are not that crucial for Swiss IT companies. Therefore, we are confident, that these regions would not rank high in our index.
For example, the lowest wage for IT employees is paid in Northern Bulgaria (on average 4 EUR per hour), this observation will receive a value of 100. The highest wage for IT employees is paid in Sweden (on average 40 EUR per hour) and consequently this observation receives a value of zero. Index values for observations between these two extremes are linearly interpolated.
We use the survey results to assign weights that reflect the relative importance of each variable within a pillar. As variables are linked to certain questions in the survey, we are able to apply the rank sum method as proposed by Danielson and Ekenberg (2017) to compute relative weights for each question and the corresponding variable based on the average importance value given by the Swiss IT firms in the survey. If more than one variable was assigned to a question, the importance weight was equally split between all assigned variables. Thus, each pillar is computed as the weighted importance of the underlying questions. Next, we weight the pillars among each other to create the overall IT Nearshoring Index. We conducted expert interviews to obtain weights for the different pillars similar to our firm survey. Experts were asked to rank the relative importance directly in percentage. Thus, in the here presented IT Nearshoring Index we do not use the rank sum method to assigned weights to each pillar, but use the direct relative importance weights provided by the experts. We feel confident that after an extensive briefing of the experts their importance valuation is actually reflecting the relative importance and not a rank importance. Table 1 gives the relative importance weight – directly obtained from the experts – and for comparison the corresponding rank sum weights for each.
Expert rating of relative importance of each pillar
| Relative importance | Rank sum weight | |
|---|---|---|
| Economic pillar | 17.35% | 6.66% |
| Location pillar | 19.91% | 26.66% |
| Social pillar | 19.21% | 13.33% |
| Institutional pillar | 19.76% | 20.00% |
| Labour pillar | 23.85% | 33.33% |
| Source: Expert ratings and authors own calculations |
Using the rank sum weight gives, by assumption, much a smaller weight to the lowest ranked pillar, in our case the economic pillar. This does not fully reflect the relative importance. As mentioned above, the interviewed experts were aware of the significance of the relative importance, while this fact was not clear for the participants of the survey. Using the rank sum weights does change the order of regions in the IT Nearshoring Index only slightly, i.e., UK regions will be even more dominant and Eastern European regions will be further down in the ranking.
More information about